


Getting started with Jmeter
Jmeter is an open-source java application developed by Apache software. Jmeter is used to capture performance statistics of an application by sending load to the target server.
Jmeter has been extended to load test Web application (using HTTP/HTTPS protocols), Webservices (using SOAP and REST), Database (using JDBC), and many more. Jmeter comes with an intuitive GUI which can be very handy to add and configure various elements like Samplers, Config elements, Listeners, Controllers, Assertions, etc.
Jmeter can be downloaded from the official site:
Download Jmeter
Download the binary from the above location and extract it. Run the setup. Once the setup is completed, the JMeter can be launched by clicking the jmeter.bat residing in the bin folder.
Difference between Load, Stress, Spike, and Endurance testing:
Performance testing has been categorized into various types. Some of the common types are described as below:
A. Load testing: Load testing is giving a fixed set of load to the application server and measure whether the application can bear the specified load or not.
B. Stress testing: Stress testing is stretching the system beyond its limit to find the threshold or breakeven point of the application.
C. Spike testing: Spike testing is giving an intermittent load to the application server. A sudden hike and a sudden drop in the given load to verify application behavior under intermittent load.
D. Endurance Testing: The load is given to the application server and the load remains persistent for a significant time to check the application behavior under sustained load.
Load test a web application through Jmeter
A website can be load tested by sending multiple HTTP requests at a time or at an interval of a specified time. The response is then captured, analyzed, and validated by applying an assertion. The intuitive GUI helps us to create a - Test Plan, Thread Group, HTTP Request sampler, Listeners, assertions, and so on.
As we know that the Jmeter works at the protocol level and not at the browser level i.e. we cannot perform or mimic exact web operations like clicking buttons, selecting dropdown values, entering values into the fields, etc. like we do in selenium automation.
But we can capture the HTTP requests and their parameters while these operations are being performed. Now if we need to give different load to different pages of the web app, we need to add multiple "HTTPRequest" to our test plan, each representing a particular page. The load specified in the thread group config element will be sent to these HTTPRequests. You can add a "Timer" to put a delay to the load generation in subsequent pages (HTTPRequests) without which the load will be generated simultaneously at all the pages.
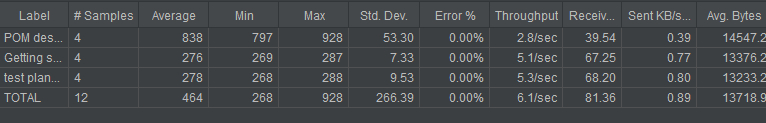
In the below image, I've created a simple load test plan on an static site.
Here the Thread group defines the number of concurrent users (Threads) you want to put on the pages underneath it.
Here "POM design pattern", "Getting started with selenium", "test planning and test strategy" are the HTTPRequest samplers which I renamed after the pages of the site. Each HTTPRequest sampler represents an HTTP request to a particular page. Here, in this case, we are targetting three pages.
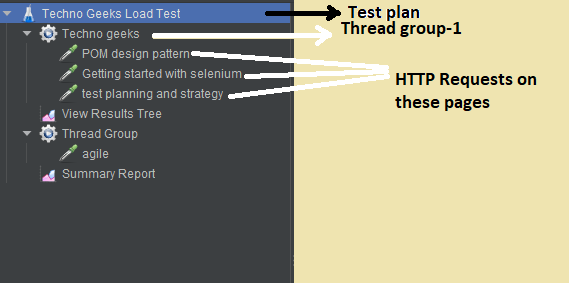
If I run this project, the thread group will generate as many HTTP requests on these three pages as there is a number of threads specified in the thread count.
In this case, I've specified 4 thread (user) count in the thread group, therefore this thread group will generate 4 HTTP requests to each of these three pages concurrently.
But in the real world, load testing a website may be way more complex. A website may require you to log in before performing any operations. The user must be a registered user and the operations can only be performed once the user gets logged into the web application. Proper authorization and authentication are required before any operation can be performed. Moreover, any user operation may require inputs from previous actions like session-id, cookie id, token id, and so on. To handle this, you need to pass appropriate request parameters and header parameters in the HTTP request of each page.
In such cases, you can start with recording the user actions using a "Recording sampler". A recording sampler will capture the HTTP requests, and parameters of every user actions and store them into respective HTTPRequest sampler created under the recording sampler during recording activity. Later you can edit the respective HTTPRequest samplers as per the requirement. The user actions are recorded, respective HTTPRequest config elements get created for every page the user has navigated. The request parameters, cookies, token, session id, etc. everything is captured in the request parameter of the corresponding HTTPRequest element. Once this is done, you need to apply the correlation using a Regular expression extractor to make the request parameters dynamically available to the subsequent requests. We'll see the correlation in the next tutorial.
But there are some prerequisites before using the Recording sampler. These prerequisites are:
1. Importing the Jmeter root certificate in the browser in which recording will be performed.
2. Setting the port of the system which should match the port number specified in the recording sampler.
Importing the Jmeter certificate and port setting
Before you begin the recording for user actions, you need to set the port through which the Recording sampler can listen through i.e. the browser port should be the same as the port which is set in the Recording sampler. Secondly, you need to import the Jmeter certificate (ApacheJMeterTemporaryRootCA.crt) into the browser.
From the template, select the "Recording" template and click create. This action will create a skeleton architecture which contains "User-defined variables", HTTPRequest, Thread count, Recording sampler, etc. Now edit the default port specified in the recording sampler or change it as per your wish.
Steps to import Jmeter certificate
Assuming you are using chrome browser for recording the user actions, follow the below steps:
1. Go to browser setting
2. Go to advance setting
3. Select Manage certificates
4. Now at the Certificate popup, click the import button.
5. Browse to the location where the Jmeter certificate is kept (You'll find the Jmeter certificate under Jmeter's bin directory)
Steps to set the proxy
The recording sampler will start a Jmeter proxy server which will listen from the port which you have specified in the port field of the recording sampler. Therefore the browser's port must be the same as specified in the recording sampler.
1. Go to the browser setting
2. Go to proxy, set the port.
3. This will open the systems, network setting window.
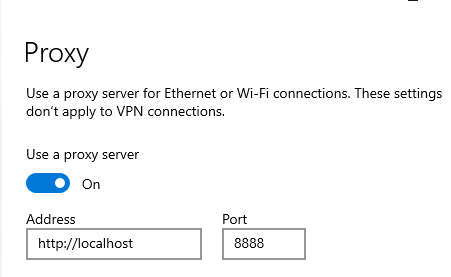
4. Go to proxy tab, and disable Automatically detect settings
5. Enable "Use a proxy server"
6. Enter "localhost" in the Address field, and enter port "8888"(same as specified in the port field of recording sampler) in the port field
7. Press save button
Recording user actions in Jmeter using Recording Sampler
Once the certificate has been imported into the target browser (the one which will be used for recording),
1. Launch the Jmeter
2. click template
3. Select "Recording" from the dropdown.
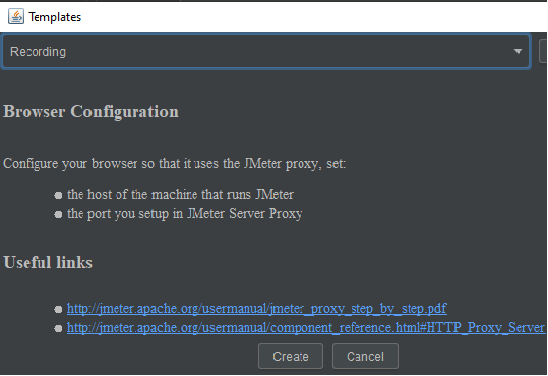
4. Enter recording parameters and click create button.
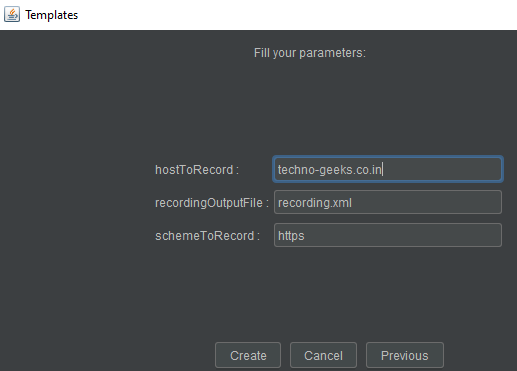
5. A recording template will be created, which will contain the skeleton architecture of the test plan, having user-defined variables, HTTP request samplers, recording samplers, and so on.
6. Under the "Test Script Recorder", select the target controller under which the recording samplers will be saved,
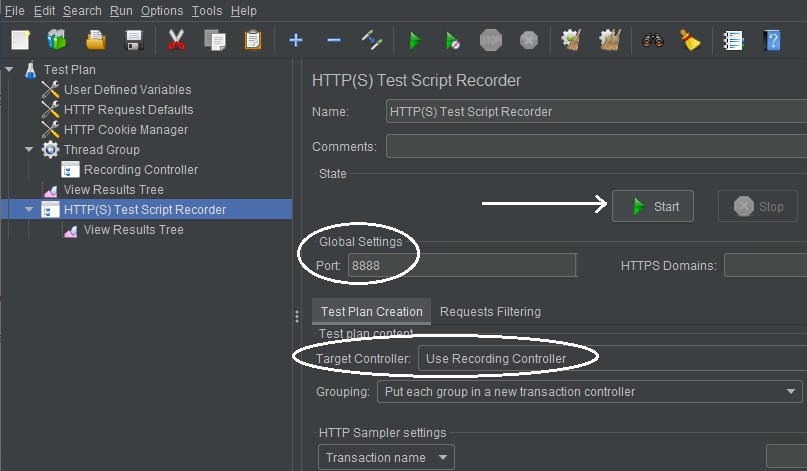
7. Click the start button and launch the browser and start navigating through the application and perform the actions for which you want the performance test.
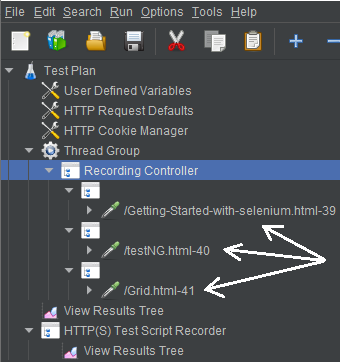
In this case, I've launched techno-geeks.co.in and navigated through three pages- "Getting started with selenium", "testNg", and "Grid".
8. Press the stop button once the user actions are performed.
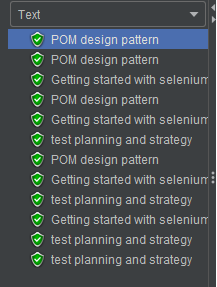
9. Observe the recording sampler. The recording sampler is populated with the HTTP request samplers for these pages.
10. Now copy the HTTPRequest samplers from the recording sampler and paste them in Thread group, and remove the recording sampler.
11. Run the project.
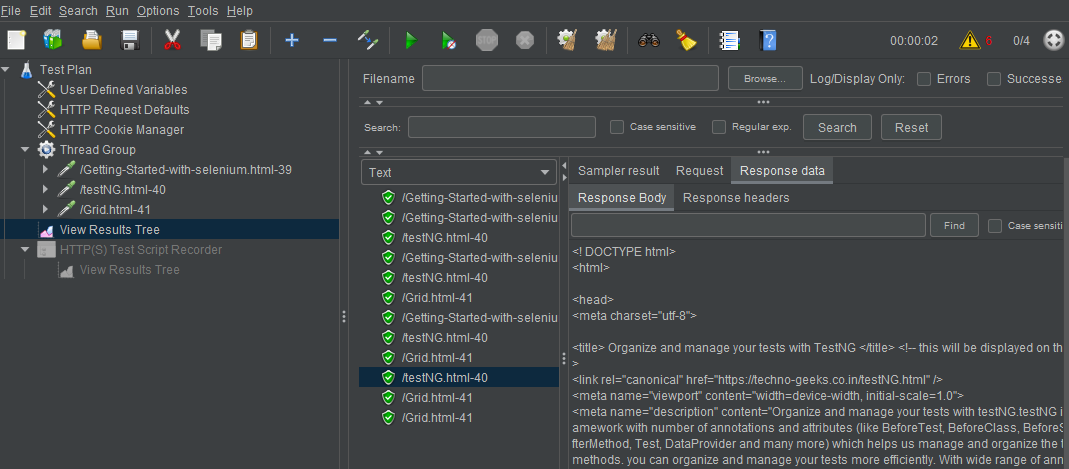
The request and response status can be seen in the tree view listener.
Other KPIs can be seen in the "Summary Report" listener.
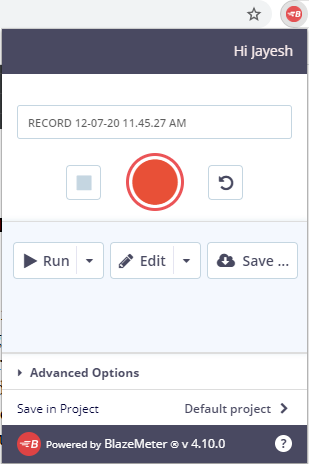
Alternate way to perform recording in Jmeter- Blazemeter plugin:
There is an easy and convenient way for recording the steps than using a recording sampler. This is the Blazemeter plugin. You can add this plugin in the chrome browser, there won't be any need to set the proxy and importing the certificate. Just start recording, perform the steps you need to record, stop the recording. The Blazemeter plugin will generate a JMX file of the recording. Open this JMX file in the JMeter and perform the changes as per your need.
Some key Performance Indicators in Jmeter
Throughput: Throughput is the number of requests sent to the server per unit of time. It is measured as the time taken by all the HTTPRequest samplers together divided by the total amount of time taken.
Latency: Latency in Jmeter is measured as a delay between the first request sent to the server and the first response received.